S/R Chart Patterns: Japanese Candles
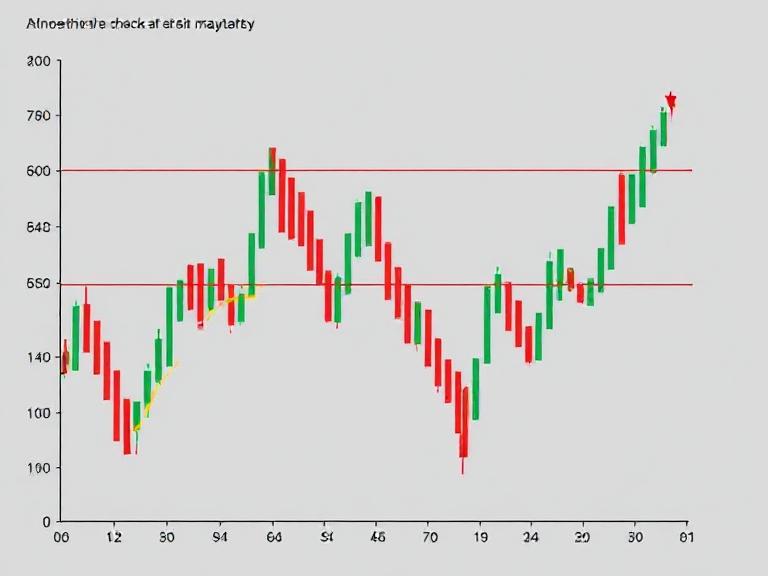
✅ Lesson 3.3 – S/R Chart Patterns: Japanese Candles “Candlestick patterns speak the language of the market – learn to read them, and the charts come alive.” 🎯 Lesson Objective This lesson introduces candlestick chart patterns and how their visual structure reflects market sentiment. These formations offer valuable insight into support/resistance behavior and trend reversal […]
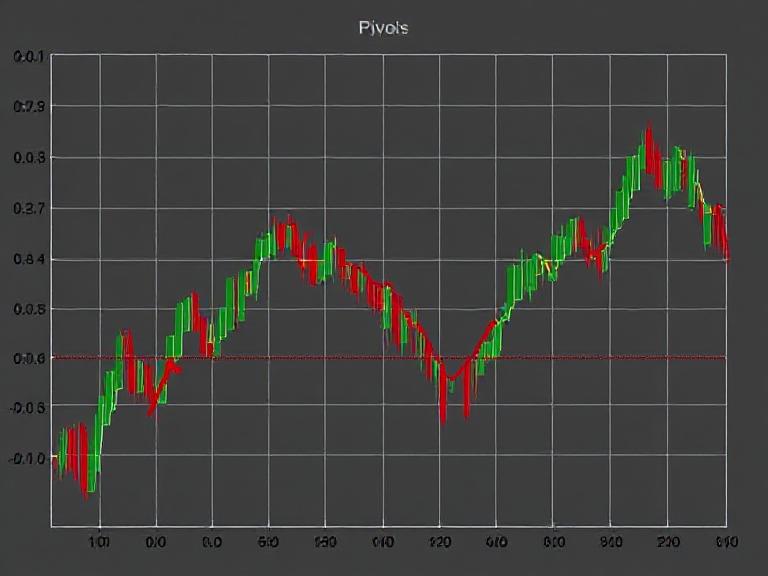
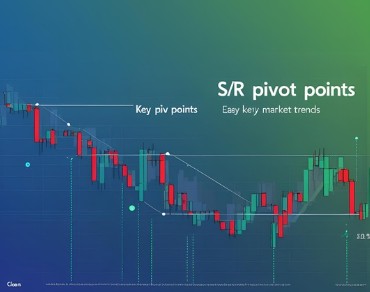
S/R Pivot Points
📊 Lesson 3.4 – S/R Pivot Points “Let the math do the work. Pivot points offer calculated guidance for market entries and exits.” 🎯 Lesson Objective Learn how to calculate and use Pivot Points – mathematically derived price levels that help identify support and resistance (S/R) zones with objectivity and clarity. 📐 What Are Pivot […]
Support & Resistance Price Levels
📈 Lesson 4.1 – Support & Resistance Price Levels “Support and resistance levels aren’t walls. They’re memories of price reactions — footprints left by supply and demand.” 🎯 Lesson Objective Understand price levels as dynamic support/resistance zones and how to identify high-probability trade areas by combining price history, trader psychology, and technical tools. 🧭 What […]

Understanding Single Trend Lines
4.2 Understanding Single Trend Lines A single trend line is one of the most basic yet powerful tools in Forex trading. As a type of support and resistance indicator, it helps traders identify potential price zones where the market may present a favorable buying or selling opportunity. When drawn on a chart, a trend line […]