 English
  8jg16
8jg16 
⚠️Lesson 2.3-Spotting Market Reversals: 3 Key Signals Traders Must Know
Knowing when the market is about to reverse can be just as important as identifying a good entry. Spotting reversals early can help you get in at the start of a new trend — or exit a trade before profits evaporate.
In this lesson, we’ll look at three powerful reversal warning signals:
-
Head and Shoulders pattern
-
Double Top/Double Bottom
-
Regular and Hidden Divergence
These tools are best used in higher timeframes to detect potential shifts, and then zooming into smaller timeframes for entry confirmation during pullbacks.
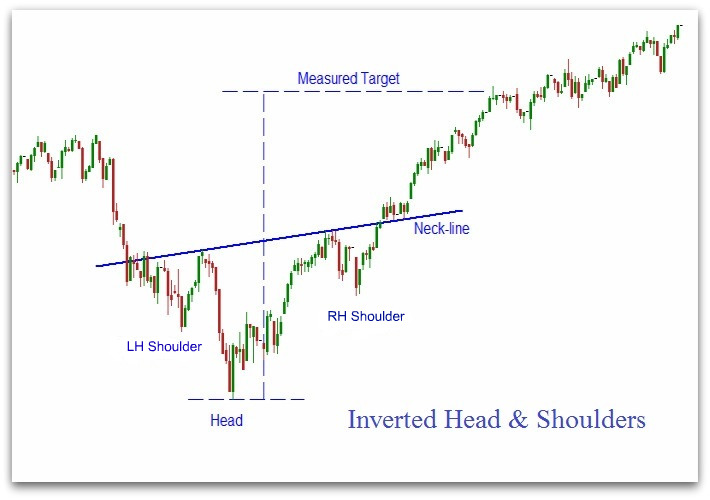
🧠 1. Head and Shoulders Pattern
The Head and Shoulders is one of the most well-known and reliable reversal patterns in trading. It indicates a trend is losing momentum and may be ready to reverse.
Structure:
-
Three peaks
-
Middle peak (the “head”) is the highest
-
Side peaks (the “shoulders”) are lower and roughly symmetrical

How to Trade It:
-
Draw the neckline by connecting the swing lows between the shoulders.
-
Wait for a break of the neckline. That’s your signal.
-
Ideal entries:
-
On the breakout
-
Or the retest of the neckline
-
Target:
Measure the distance from the top of the head to the neckline and project it downward from the break.
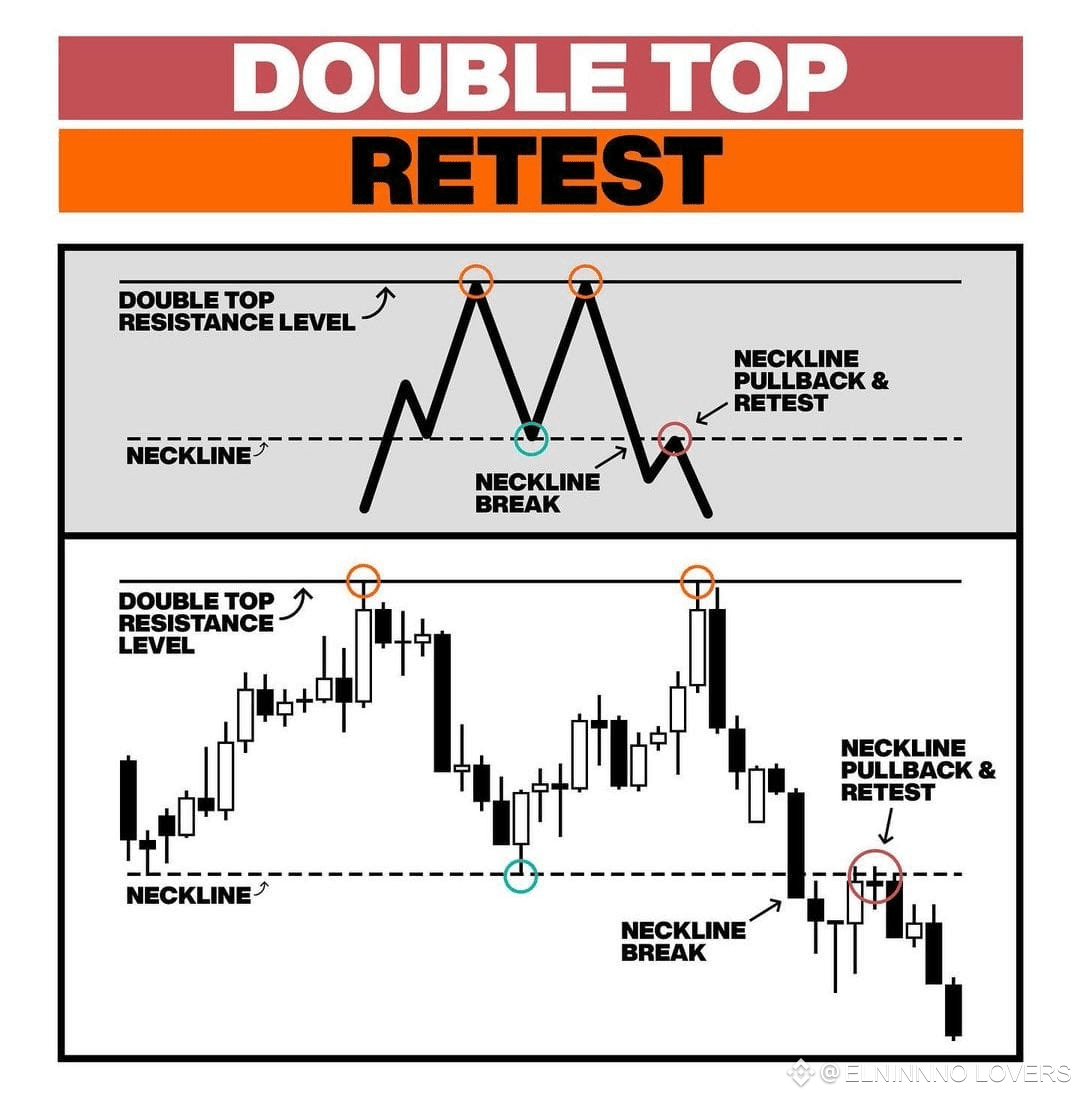
🔁 2. Double Top / Double Bottom
This reversal pattern occurs when price tests a key level twice but fails to break through.
-
Double Top = Two highs near the same level → bearish reversal
-
Double Bottom = Two lows near the same level → bullish reversal
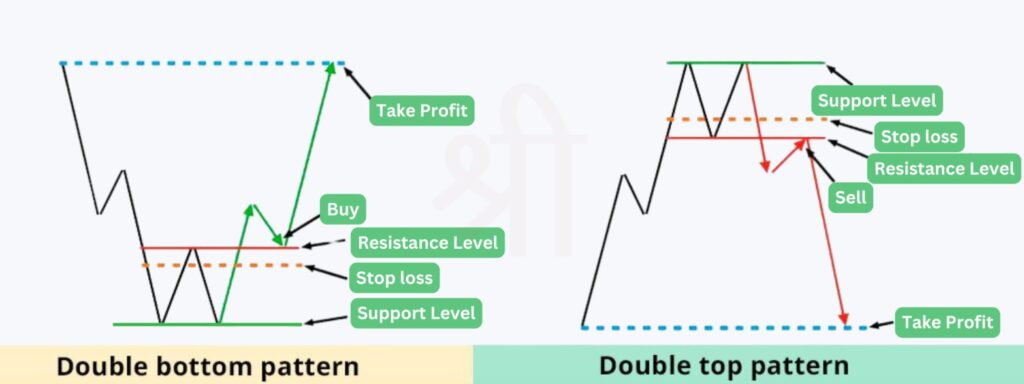
Trading Tip:
-
Avoid entering immediately on the breakout.
-
Instead, wait for a confirmed break and retest or switch to a lower timeframe for refined entry.
Also, be mindful of stop hunts, where price slightly breaches the previous high/low to trigger stops before reversing. These can improve the reliability of the pattern if followed by a strong move in the opposite direction.
📉 3. Divergence: A Momentum-Based Warning
Divergence occurs when price and an oscillator (like RSI or Stochastic) are telling two different stories.
-
Price makes a higher high, but the oscillator makes a lower high → bearish divergence
-
Price makes a lower low, but the oscillator makes a higher low → bullish divergence
-

Best Oscillators:
-
RSI (14) – widely used and effective
-
Stochastic (8,3,3) – alternative oscillator for confirmation
Divergence helps you avoid false entries by showing weakening momentum, even if price seems to be trending.


🔄 Hidden Divergence: For Trend Continuation
Hidden divergence works in the opposite direction:
-
Use it to confirm a trend continuation, not reversal.
-
In an uptrend: price makes a higher low, but oscillator shows a lower low
-
In a downtrend: price makes a lower high, but oscillator shows a higher high

Example of hidden bearish divergence in a downtrend — price makes lower high, oscillator makes higher high.

These setups are great for confirming pullbacks as re-entry points within an ongoing trend.
🧭 Putting It All Together
Use these reversal signs not in isolation, but as early warnings:
-
Confirm with candlestick patterns, multi-timeframe analysis, and support/resistance zones
-
Then use lower timeframes for precise entries
✅ Summary
| Reversal Signal | Description | Best Use Case |
|---|---|---|
| Head & Shoulders | Classic 3-peak pattern, signals a trend change | Break/retest entry on neckline |
| Double Top/Bottom | Price retests key high/low but fails | Bias shift confirmation before entries |
| Divergence | Price vs Oscillator disagreement | Detect hidden weakness or strength |
| Hidden Divergence | Confirms trend continuation | Low-risk entries in trending markets |
🚀 Final Thought
Most new traders get caught trying to “catch the top or bottom.” Instead, focus on identifying a potential reversal, wait for confirmation, and then align with the new momentum.
Trade smart, wait for your setup, and remember: the trend is your friend — until it ends.