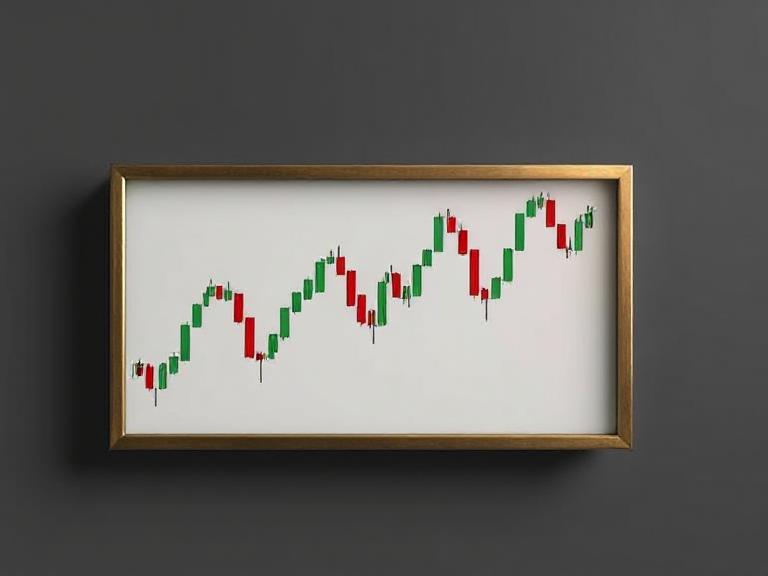
✅ Lesson 2.1 – Candle Anatomy and Meaning
Learn how candlestick structures reveal trader sentiment and signal future price movements.
🧭 Introduction to Candlestick Analysis
Understanding candlesticks is essential for interpreting market psychology. A candlestick not only shows where price has been, but also gives clues about potential direction, especially around key support and resistance levels.
Candlestick charts can help traders:
-
Identify buying/selling pressure
-
Spot possible reversals or continuations
-
Make smarter entry and exit decisions
🔍 What is a Candlestick?
Each candlestick represents price movement over a specific time frame (e.g., 1 minute, 1 hour, 1 day).
A single candle provides four key data points:
-
Open – The price at the beginning of the time period
-
High – The highest price reached
-
Low – The lowest price reached
-
Close – The price at the end of the time period
🧱 Parts of a Candle
-
Body (Real Body):
The range between the opening and closing prices.-
Green Body → Price closed higher than it opened (bullish)
-
Red Body → Price closed lower than it opened (bearish)
-
-
Wick (or Shadow):
The thin lines above and below the body.-
Upper Wick → High of the session
-
Lower Wick → Low of the session
-
If missing, the open or close was also the high or low
-
🕯️ Candles without wicks are called “full body candles” and indicate strong directional pressure.
⏱️ Time Frame Examples
-
A 1-minute candle shows price action for one minute
-
A daily candle shows the full trading activity of a single day
🧠 How to Read Candlestick Behavior
📉 Long Wicks + Small Body
-
Signals indecision in the market
-
Buyers and sellers fought for control, but price closed near where it started
-
Common in Doji candles and may suggest reversal or trend exhaustion
Example: Doji

-
Little to no body
-
Long wicks on either side
-
Reflects a market that’s pausing or unsure
🔁 Potential Reversal
If seen after a strong trend, long wicks and short bodies often signal a shift in momentum.
📈 Long Body + Small or No Wick
-
Indicates strong, decisive movement
-
Little opposition from the other side (buyers or sellers)
-
Suggests trend continuation
Example: Bullish/Bearish Marubozu
-
Very long green or red body
-
No wicks → Strong conviction in direction

🔨 Special Reversal Patterns
✅ Hammer (Bullish Reversal)
-
Small body at the top
-
Long lower wick
-
Appears after a downtrend
-
Indicates buyers regained control after strong selling
⚠️ Hanging Man (Bearish Reversal)
-
Same structure as hammer
-
Appears after an uptrend
-
Signals potential weakness or trend reversal

📘 Lesson Summary
-
Candlestick anatomy helps you interpret market psychology at a glance
-
Wicks show volatility and indecision
-
Bodies reveal buying/selling strength
-
Look for context (trend direction, support/resistance) when interpreting candles
📘 In the next lesson, we’ll explore common candlestick patterns and how they’re used in real trading strategies.

 English


