 English
  8jg16
8jg16 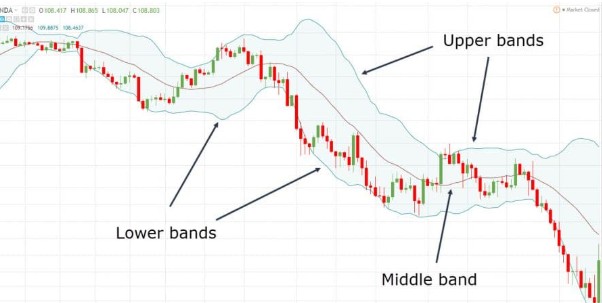
4.5 Support & Resistance: Trend Lines – Bollinger Bands (BBs)
🔍 Lesson Overview
In this lesson, we introduce Bollinger Bands (BBs)—a dynamic indicator that combines the features of simple moving averages (SMAs) and price channels. Bollinger Bands help traders identify both support and resistance levels and market momentum by adjusting to price volatility.
📘 What Are Bollinger Bands?
Bollinger Bands are composed of:
- A 20-period SMA (the middle line),
- An upper band plotted x standard deviations above the SMA,
- A lower band plotted x standard deviations below the SMA.
Default settings are typically “20, 2”, meaning 20 periods and 2 standard deviations above and below the average.
This structure creates a price envelope that visually captures market volatility and potential support/resistance zones.
📈 Why Use Bollinger Bands?
1. Objective and Universal
Like moving averages, Bollinger Bands are calculated mathematically, making them objective. This means every trader using the same settings sees the exact same levels—providing insight into what the “crowd” is watching.
2. Built-In Volatility Tracking
The band width expands and contracts based on volatility:
- Tight Bands → Low volatility (quiet markets)
- Wide Bands → High volatility (active markets)
When bands narrow (known as a Bollinger Squeeze), it often signals an upcoming breakout. A break above the upper band may signal bullish momentum; a break below the lower band may indicate bearish momentum.
3. Dynamic Support & Resistance
In range-bound markets, Bollinger Bands often act like a rubber band, with price bouncing between the upper and lower bands:
- Upper Band = Resistance
- Lower Band = Support
⚠️ When Bollinger Bands May Not Work Well
While effective in sideways (consolidating) markets, Bollinger Bands can fail in strong trends. For example:
- In a strong uptrend, price may ride the upper band, never pulling back enough to “bounce” off support.
- In a strong downtrend, price may hug the lower band, making long entries ineffective.
This is because trending markets reflect a shift in perception about value, breaking the statistical assumptions of BBs which are based on historical price distribution.
📊 Key Observations
- Bollinger Bands are built around the assumption that 95% of price action stays within the 2-standard-deviation envelope (i.e., between upper and lower bands).
- However, in strong trends, price often “walks the band”—hugging one side and invalidating the bounce logic.
- In range-bound markets, Bollinger Bands perform well as dynamic S/R levels, especially when aligned with horizontal price zones.
🧠 Two Classic Bollinger Band Strategies
| Strategy | Description | Market Condition |
|---|---|---|
| Bollinger Bounce | Price reverts to the mean (center SMA) after touching outer bands | Range-bound market |
| Bollinger Squeeze | Bands narrow before a volatility breakout | Pre-breakout condition |
We’ll explore these strategies in more detail later in the course.
📌 Example Recap
In past charts, we’ve seen:
- Bollinger Bands acting as boundaries in sideways markets (like a ball bouncing between the ceiling and floor).
- Bollinger Bands failing to act as resistance in uptrends, where price continues to push the upper band higher.
These patterns highlight the importance of context—using Bollinger Bands with trend analysis and other indicators, such as candlestick signals, price structure, and the IRATE framework.
✅ Conclusion
Bollinger Bands are a versatile tool that provide insight into both trend momentum and dynamic support/resistance levels. When used correctly—especially in sideways markets—they can enhance timing and decision-making. However, in trending conditions, it’s important to adapt your strategy accordingly.
Next, we’ll introduce how to use Bollinger Bands as a momentum indicator and incorporate them into trade setups.