 English
  8jg16
8jg16 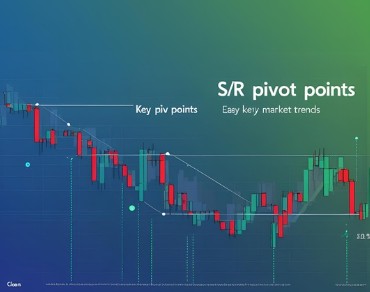
📈 Lesson 4.1 – Support & Resistance Price Levels
“Support and resistance levels aren’t walls. They’re memories of price reactions — footprints left by supply and demand.”
🎯 Lesson Objective
Understand price levels as dynamic support/resistance zones and how to identify high-probability trade areas by combining price history, trader psychology, and technical tools.
🧭 What Are S/R Price Levels?
Support/resistance price levels are zones (not exact prices) where trends tend to start, pause, or reverse.
🧠 Why They Matter:
-
Price reacts where buyers/sellers previously entered in force
-
Orders may still be “parked” at these levels
-
Psychological memory influences future market decisions
📊 Key Characteristics
| 🔍 Trait | 💡 Meaning |
|---|---|
| Price Band, Not Pip | S/R usually spans a range, not a precise pip |
| Memory Effect | Former resistance becomes support, and vice versa |
| IRATE Strength | Stronger levels = more reliable trading zones |
🧩 The IRATE Criteria
| Letter | Factor | Description |
|---|---|---|
| I | Indicators | More technical tools pointing to the same level (e.g. MA, Bollinger, Fibonacci) |
| R | Round Numbers | Price levels ending in .0000, .5000 often respected |
| A | Age | Older S/R levels = stronger significance |
| T | Tested | More touches = stronger S/R (up to a point) |
| E | Environment (Confluence) | When several factors align — confluence creates confidence |
🔍 Real Chart Examples
Example:
-
Price level 1.3800 served as strong resistance, reinforced by 5 separate technical indicators
-
On long-term charts, S/R zones between 1.1700 and 1.2000 acted as major historical support for years
🧠 Instructor Notes
Don’t treat support/resistance as magical lines. They are emotional footprints of supply and demand.
Trade near confluence (IRATE criteria) for the highest probability setups. The older, tested, and more confirmed a level is, the more likely it will hold.