✅ Lesson 3.3 – S/R Chart Patterns: Japanese Candles
“Candlestick patterns speak the language of the market – learn to read them, and the charts come alive.”
🎯 Lesson Objective
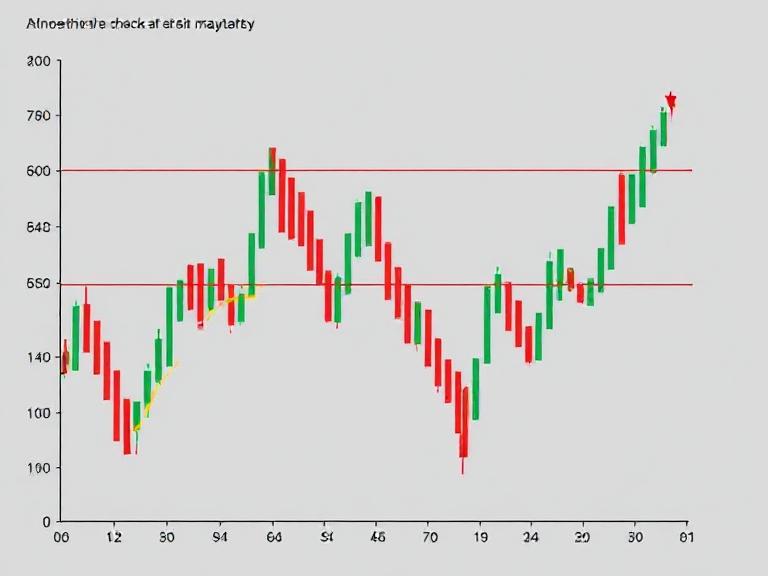
This lesson introduces candlestick chart patterns and how their visual structure reflects market sentiment. These formations offer valuable insight into support/resistance behavior and trend reversal signals.
🕯️ What Are Japanese Candlestick Patterns?
Candlestick charts use four key price points for a time period:
-
Open
-
High
-
Low
-
Close
They form candles whose shape and shadow length convey trader sentiment and market direction.
| Candle Feature | Meaning |
|---|---|
| 📏 Long body | Strong buying/selling – little hesitation |
| 📉 Short body | Indecision – tug-of-war between bulls and bears |
| 🔼 Long upper wick | Price moved higher but was rejected |
| 🔽 Long lower wick | Price dropped lower but recovered |
🧭 Understanding Candle Types
🔵 Bullish Candles (Close > Open)
-
Often hollow or light-colored
-
Signal buying pressure
-
Especially meaningful when occurring near support zones
🔴 Bearish Candles (Close < Open)
-
Often filled or dark-colored
-
Signal selling pressure
-
Stronger impact when near resistance
🔁 Indecision Candles
Candles with short bodies and long wicks (like Doji) reflect uncertainty. Prices moved up and down during the session but closed near where they opened.
Traders interpret this as a pause in market direction, which can signal an upcoming reversal — especially near strong S/R.
🧩 Chart Pattern Example: Head and Shoulders
A common bearish reversal pattern in candlestick formations:
🟠 When This Appears:
-
During an uptrend
-
Suggests buying is weakening
-
Expect a potential downward move
🧠 Key Takeaways
| Insight | Description |
|---|---|
| 🔍 Candles that close near their high = bullish signal | |
| 🔻 Candles that close near their low = bearish signal | |
| ✖️ Failure to make higher highs in uptrend = potential trend reversal | |
| ✅ Reversal signals are stronger with confirmation (e.g. engulfing or breakout) |
📘 Instructor Notes
Don’t try to memorize every pattern. Instead, understand the logic behind candle formations:
-
Where they appear
-
How they relate to S/R
-
Whether they appear in trending or range-bound markets
Over time, you’ll naturally recognize the key setups that matter most.

 English


